
The SparqFest Dashboard is your “home page” in the Staff Portal.
Prior to the April 2023 release (v2023.04.12.01), we had a very rudimentary dashboard with reporting spread throughout the Staff Portal. With this update, the dashboard has become a single location for checking in your festival's online operations, identifying critical actions that need to be taken, and accessing charts and reports.
Overview
When access the Staff Portal, you are taken directly to the dashboard. The appearance of the dashboard depends on where your selected edition sits in the “lifecycle” of a festival edition. It changes as you move from planning your festival into the running event and then provides a final view after the festival.
Reviewing Historical Data
You can always look back on a prior edition by navigating to that edition using the menu at the top of the screen. When you change to a prior, the dashboard will show you the final data for that specific edition.
Regardless of what the current state of your selected edition is, you will see three core sections:
- A main area that states what phase your edition is in and any critical actions that need to be taken
- A dashboard menu that links to other parts of the dashboard (currently, only “Reports”)
- Various charts and data reflecting the current state of that edition
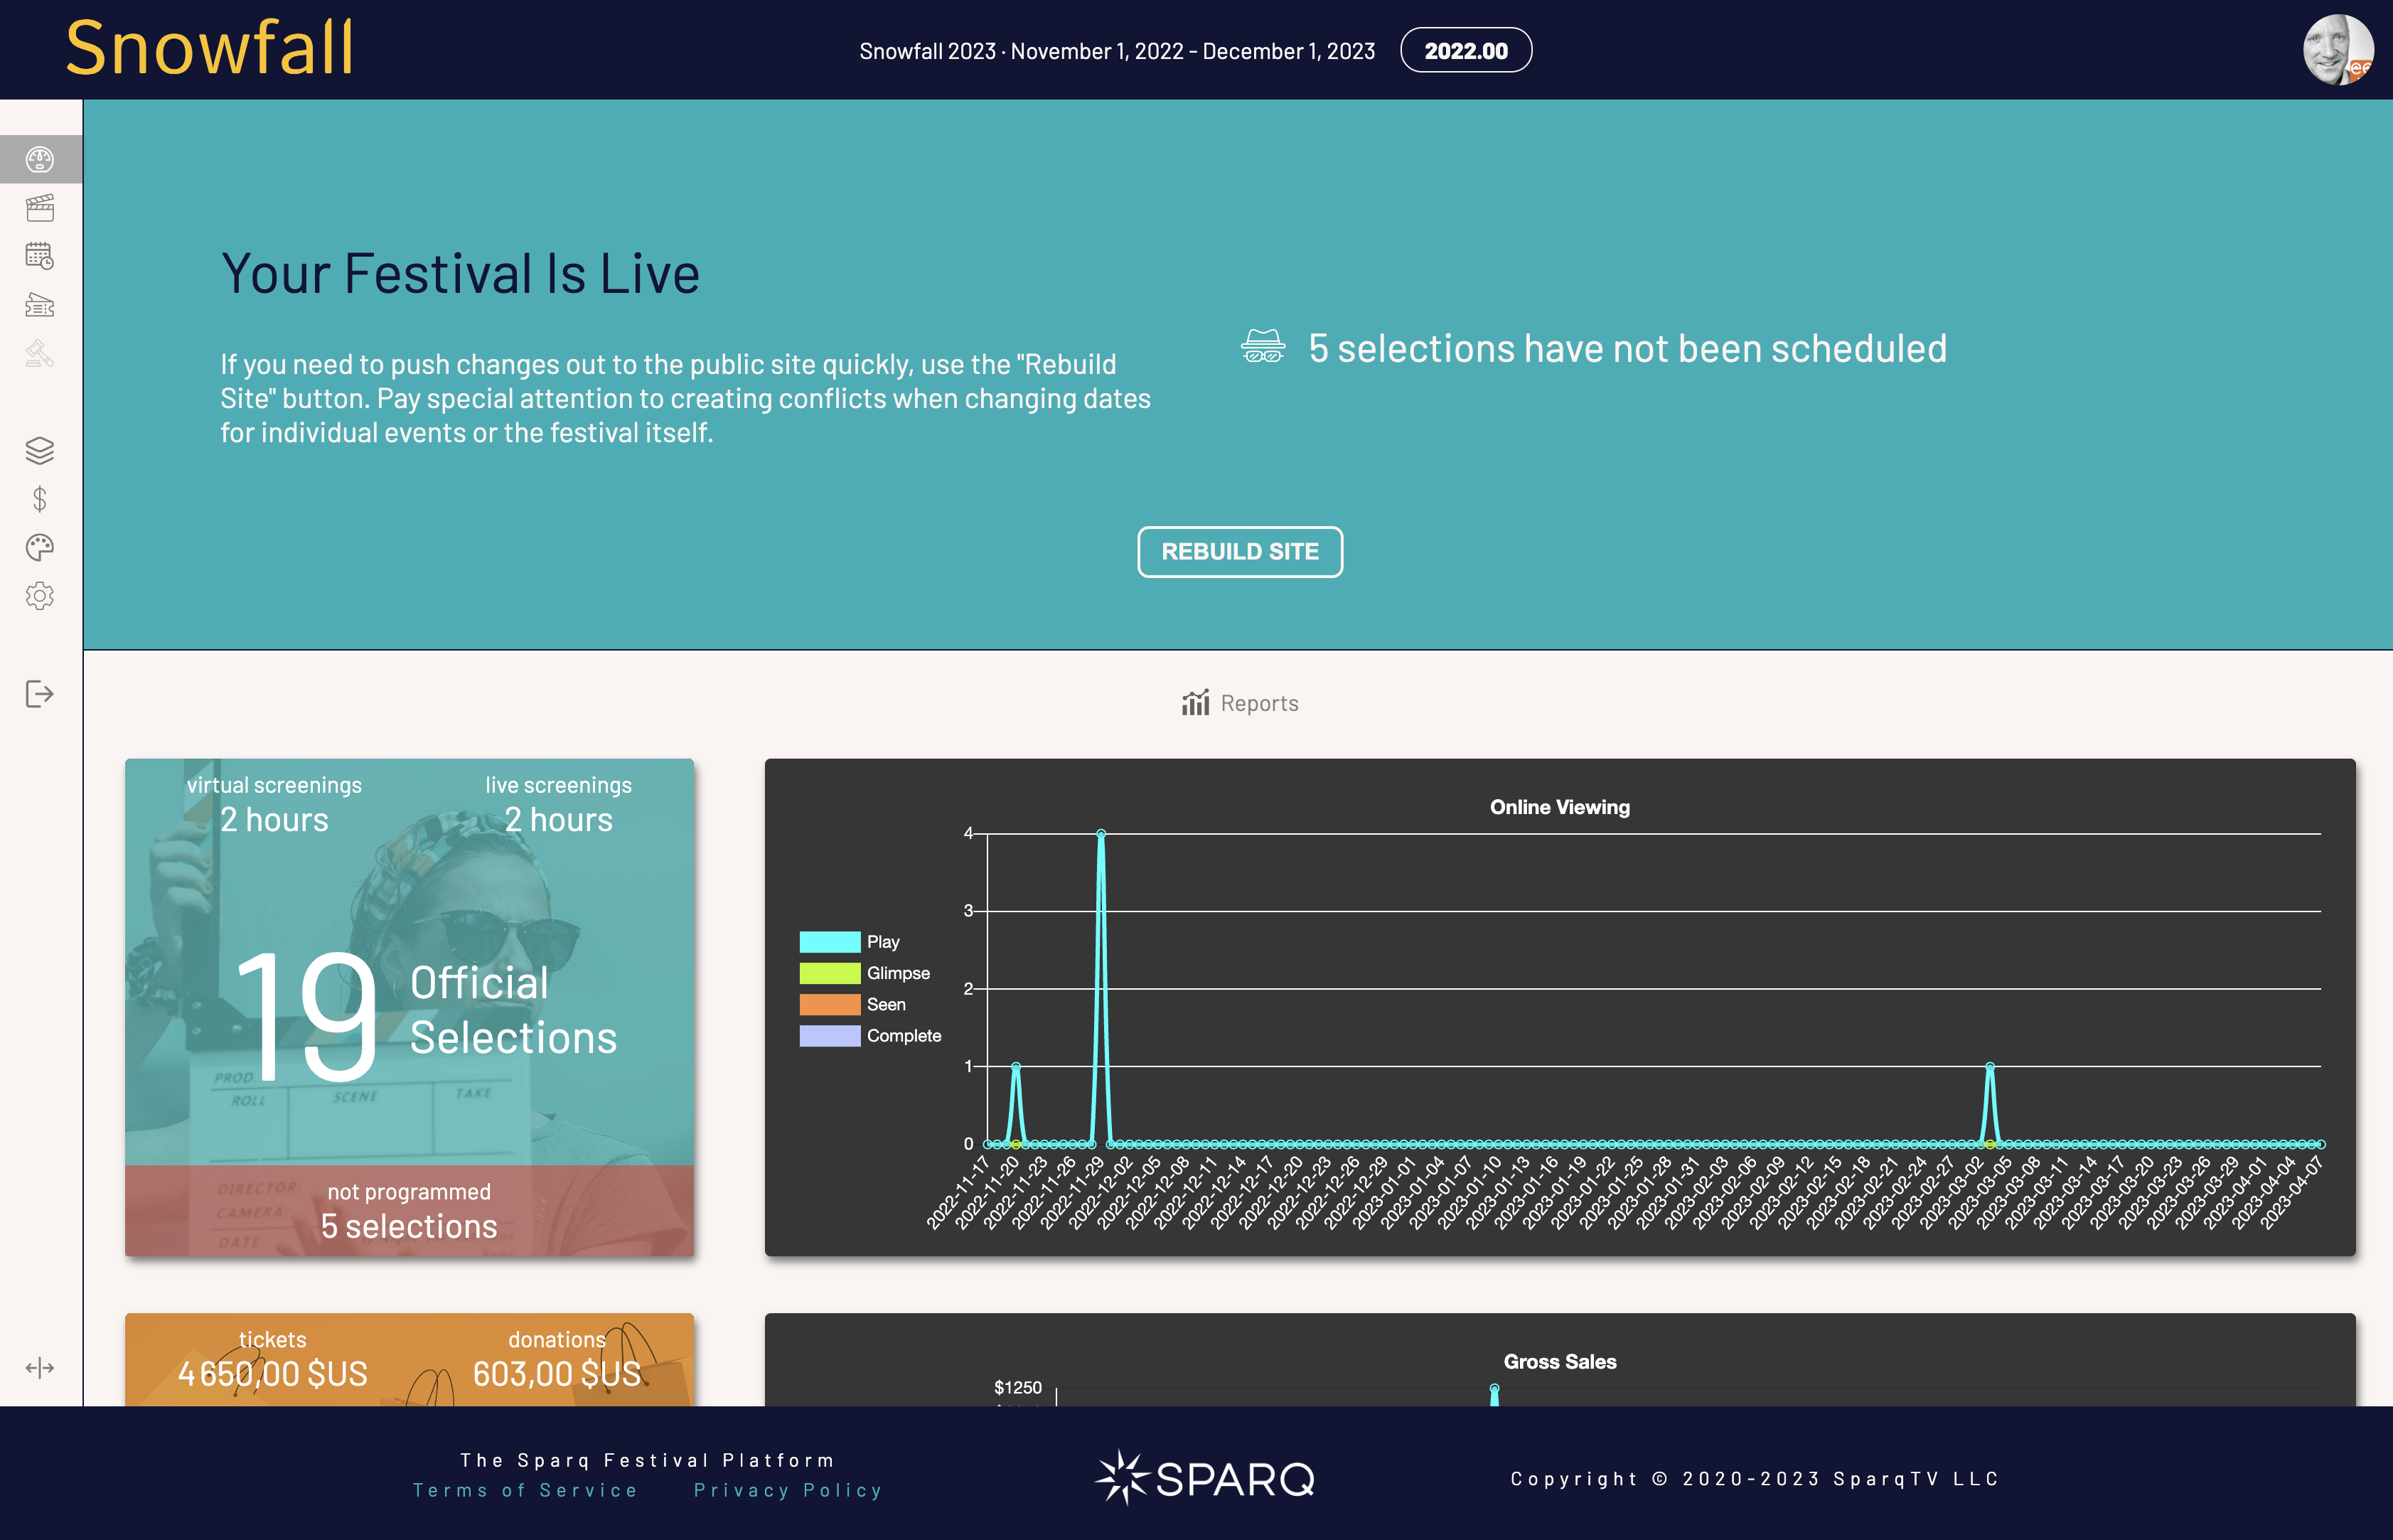
The Main Section
The main section for the festival above shows that the festival is now live along with the list of critical tasks. If your festival is currently live, you want there to be no critical tasks. This example shows that there are 5 selections that have not been scheduled into a virtual screening or in-person screening. Clicking on the task takes you directly to the programming section so you can program it into a virtual or in-person screening.
Here are some examples of the main section for various phases of an edition:
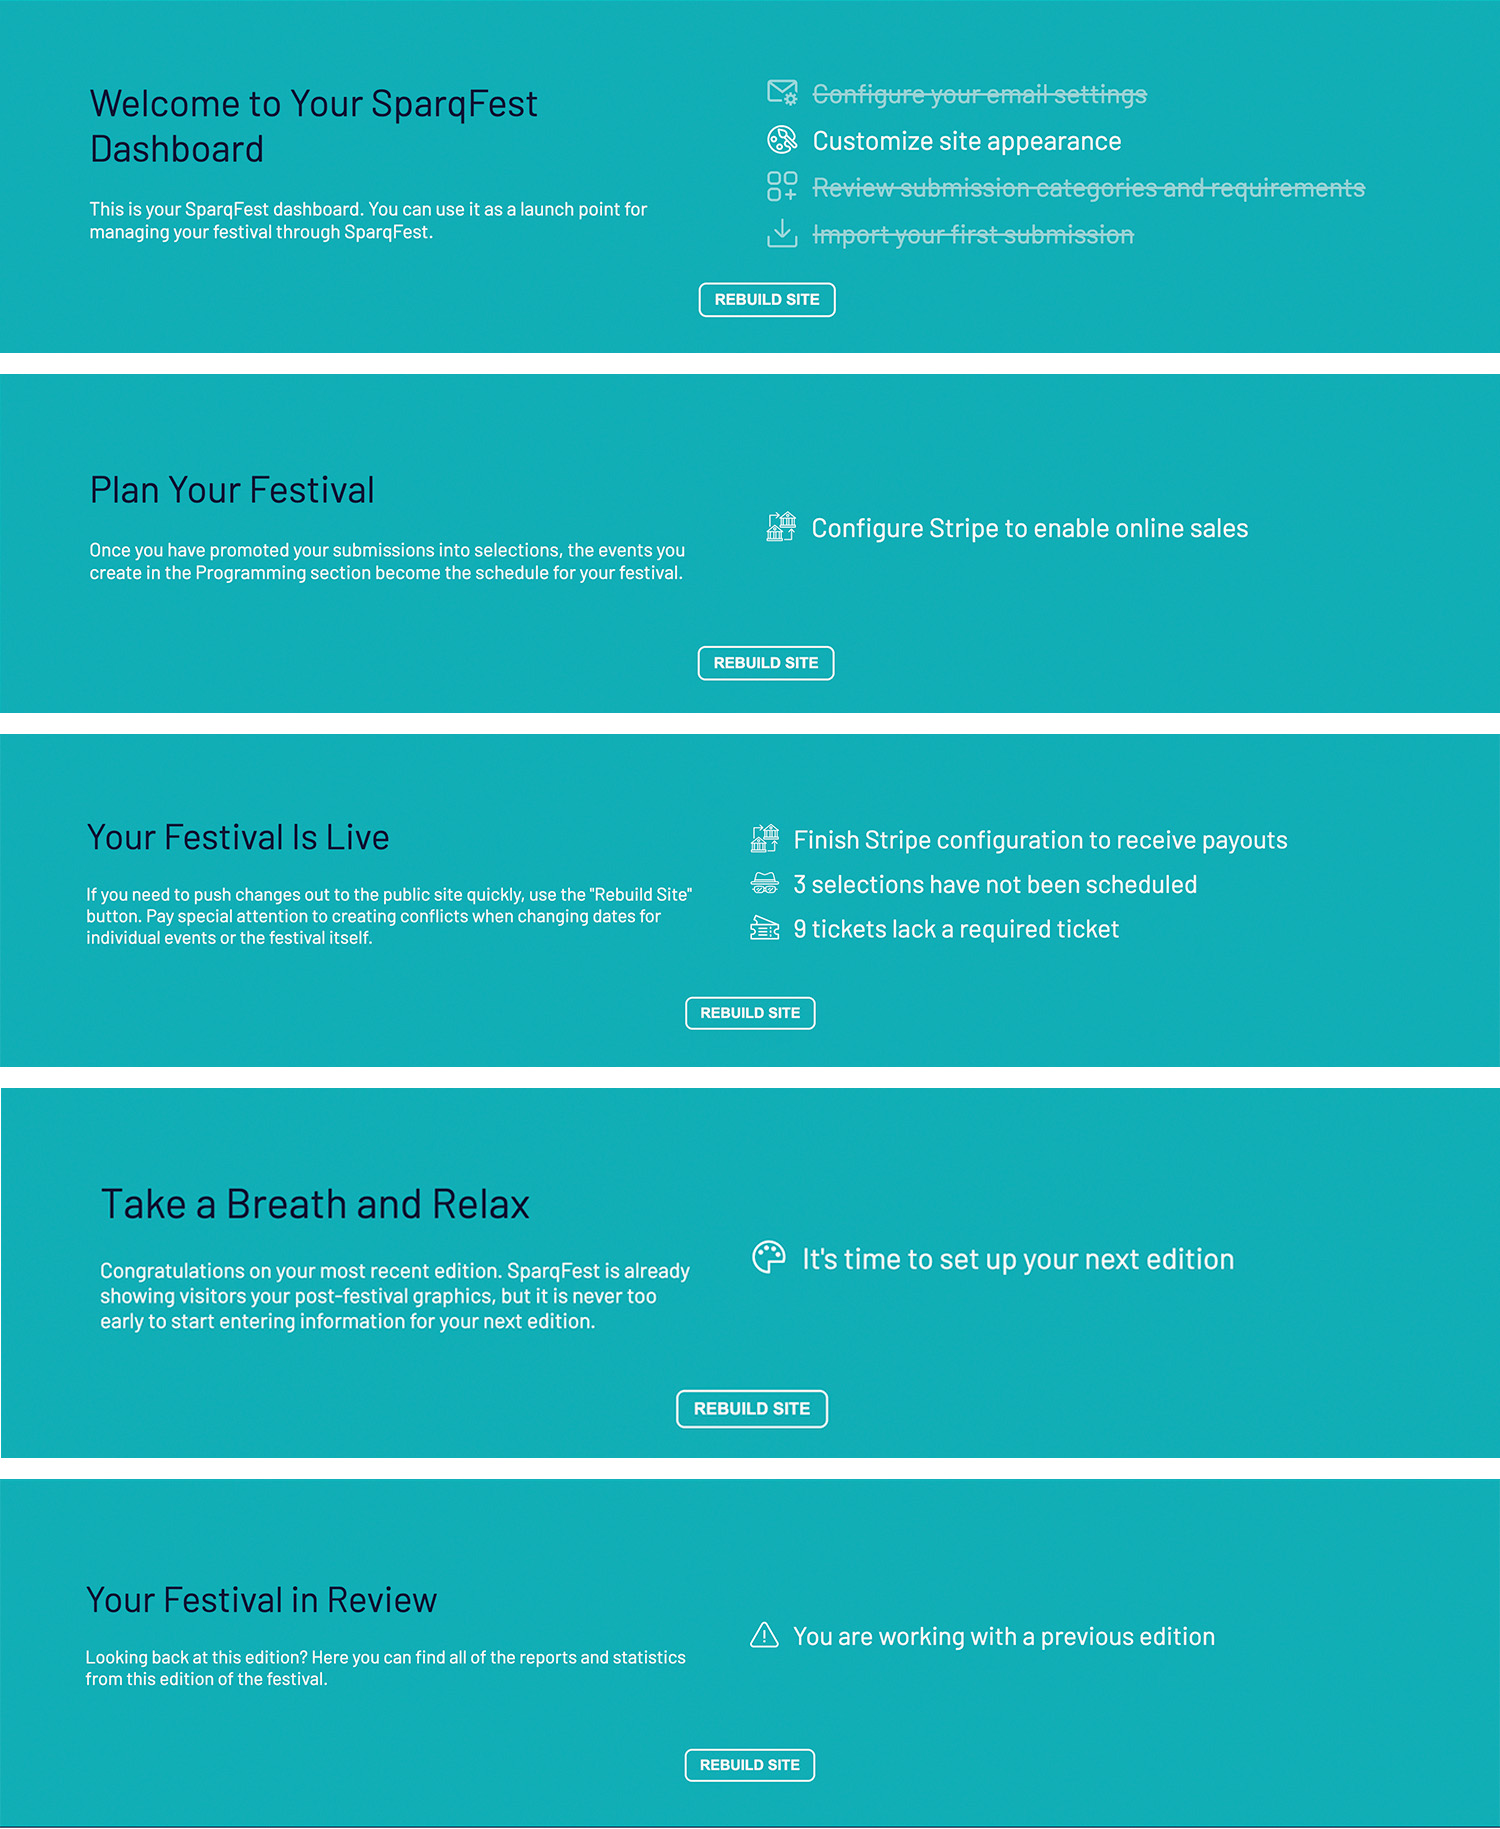
You see the initial phase only as a new SparqFest customer. Obviously, there isn't much data to show when you first sign-up, so the focus is on guiding you through your critical first tasks.
Once you have completed those initial tasks, your dashboard goes into the “planning” phase. The planning phase runs up until the start date of your festival. If you have separate online and in-person dates, the start of the festival is considered the first of those two dates. During the planning phase, the focus of the dashboard is making sure you have everything ready for the live festival.
When the festival starts, the dashboard enters the “running” phase. While the festival is running, the dashboard gives you quick access to operational data and calls out any items that might be an issue for a live festival.
After the festival ends, the dashboard enters its final phase: “post-festival”. The only task you have for a “post-festival” edition is to set up the next edition. The focus of this dashboard is thus to give you access to all of the data from your completed event.
One element that always appears in the main section of your dashboard is the “Rebuild Site” button. As discussed elsewhere in our knowledge base, we create a static picture of your web site for easy search engine optimization. Consequently, the changes made in the various portals are not immediately reflected in the live site. The “Rebuild Site” button enables you to force an immediate re-build of the site.
On Caching
The public site is cached at a number of levels. The first is the static site that is regularly cached (roughly every 4 hours) or that you can re-cache by clicking the “Rebuild Site” button.
A second level of caching occurs just above that at what's called the “CDN (content delivery network)” level. When the site is rebuilt, we push the new content to “edge” locations all over the world so that it is easier for people to access quickly.
The third level of caching is not controlled by us: it happens in the browser. Browsers will cache web pages for quicker delivery.
The point of all of this caching is, of course, to speed up content delivery, especially in limited bandwidth situations. The downside, however, is that it takes time for some users to see any changes you make. when you click “Rebuild Site”, you rebuild the first two caches, but the third is entirely out of your control.
Dashboard Navigation
The dashboard navigation provides links to drill down into your festival data. Currently, the only navigation item is a “Reports” menu item that pulls up a dialog with a list of reports. Click on a report, and a CSV will be downloaded that you can open with a spreadsheet tool like Excel, Numbers, or Google Spreadsheets.
Charts and Data
The remainder of the dashboard is all various charts and data. What appears here is highly specific to what phase your festival is in and what data we have collected. The remainder of this document dives into what this information tells you.
Activity Chart
Phases: running, post-festival
The activity chart shows the data for your online screenings. In particular, it breaks down viewing by “Plays”, “Glimpses”, “Seens”, and “Completes” for each day of the festival.
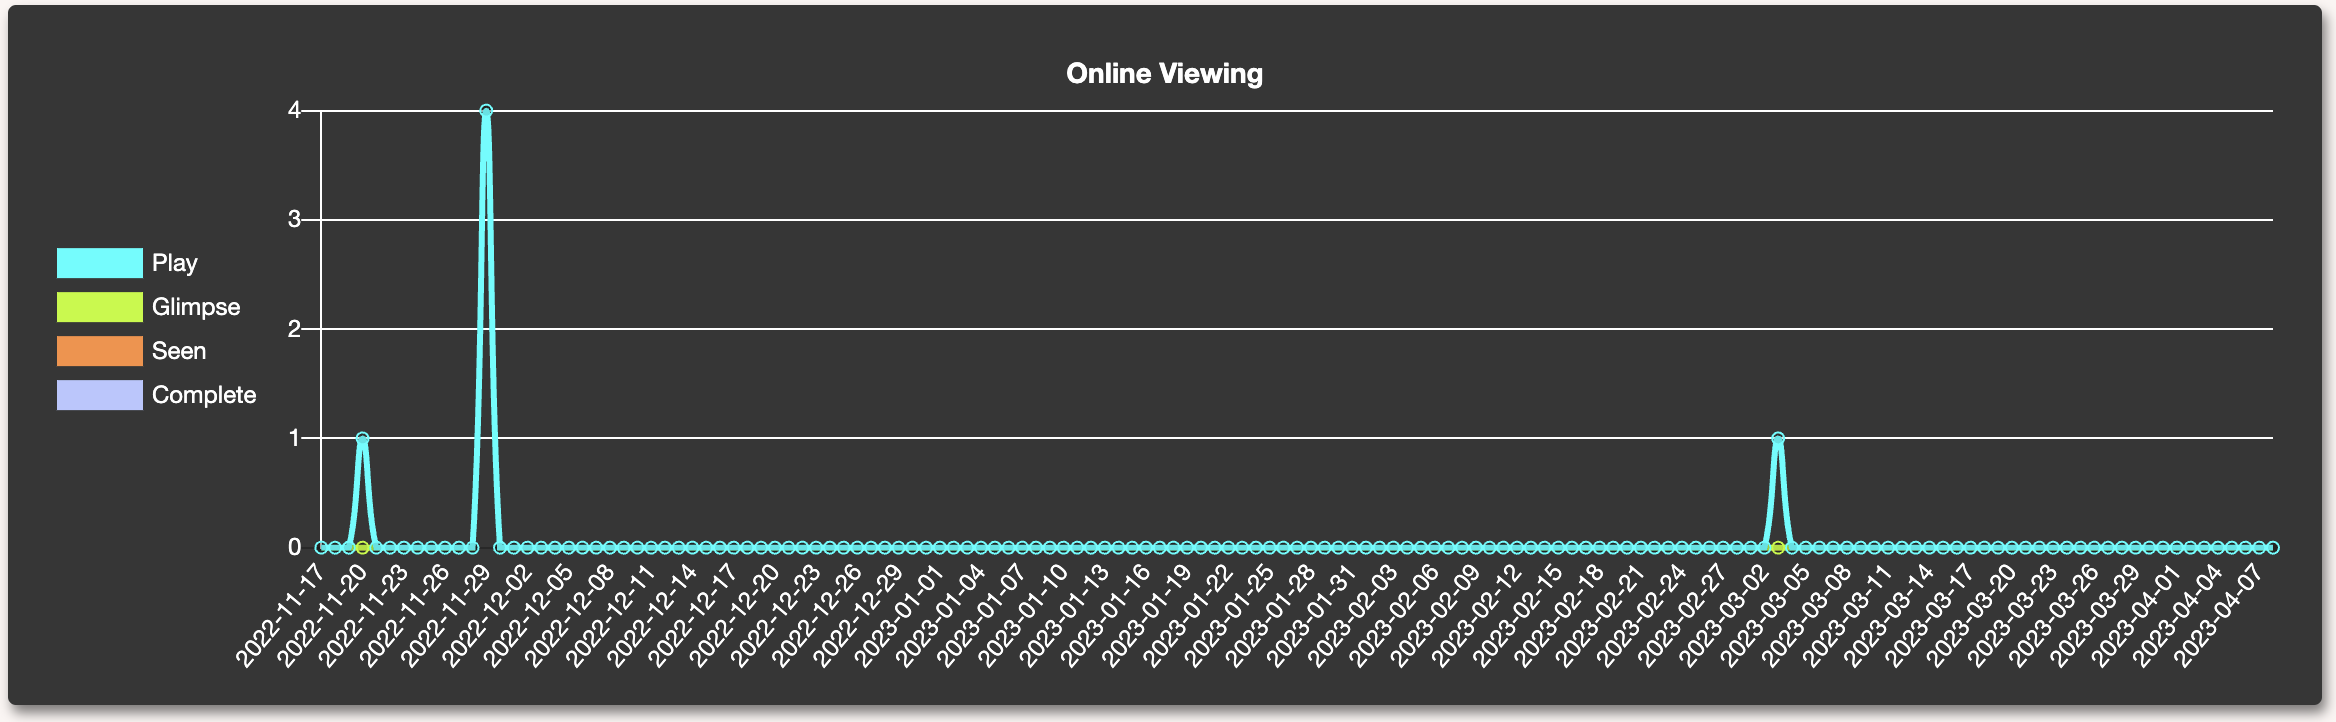
Plays - How many times someone has started watching the selection
Glimpses - How many times someone has watched at least 10% of the selection
Seens - How many times someone has watched at last 80% of the selection
Completes - How many times someone has watched the last frame of a selection
We consider “seens” to be the best metric of really watching a selection. While “completes” can indicate selections that have been watched all the way through, they can also represent a selection in which a viewer skips to the end. Completes can therefore be theoretically greater than “seens” or even “glimpses”.
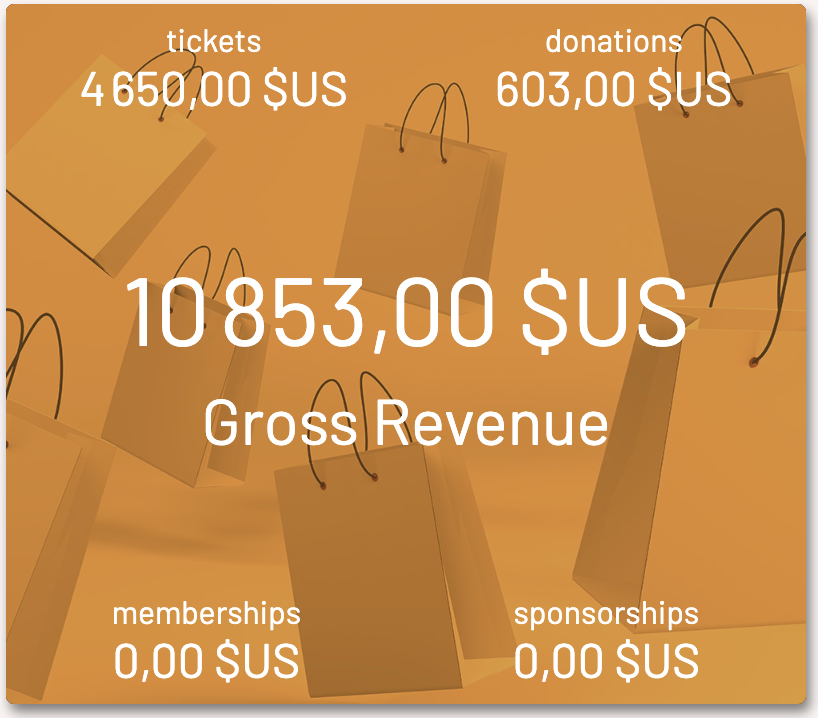
Gross Sales
Phases: planning, running, post-festival
The “Gross Sales” widget is the one widget that shows up no matter what phase you are in. It indicates your sales across the various things that can be sold on your SparqFest web site before any SparqFest fees are deducted. These numbers are also “before discount” numbers. If the bulk of your visitors have made purchases using discount codes, your net sales will be much lower than the gross sales value.
The widget shows four different things that we can sell. Depending on how you use SparqFest, some (or all) of these values may be 0.
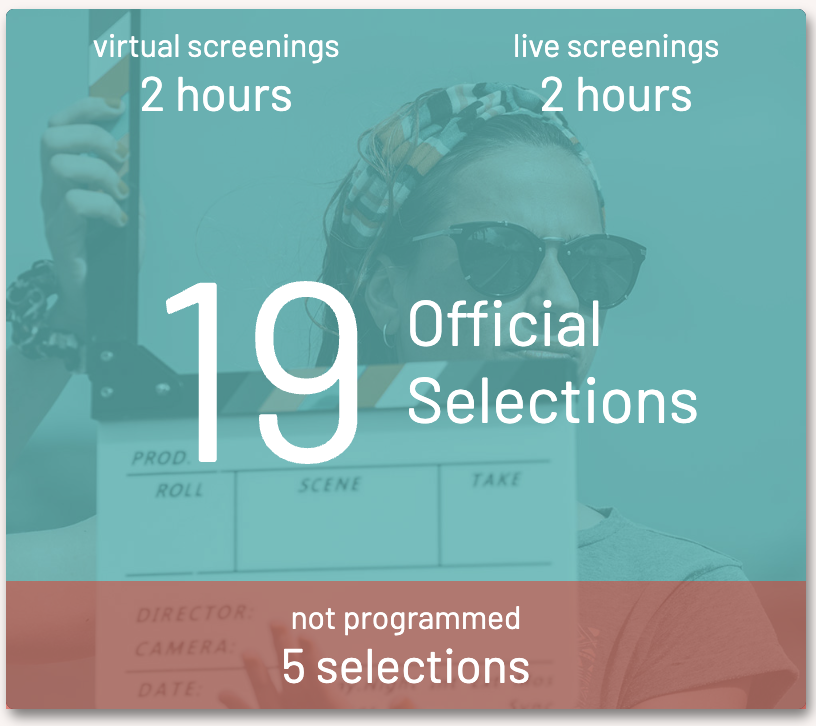
Programmed Selections
Phases: planning, running
This widget tells you exactly what you have programmed into the festival up to this point and breaks that programming down by number of hours programmed for virtual and live screenings.
In this example, the festival has 19 Official Selections programmed into 2 hours of content as virtual screenings and another 2 hours as live screenings. Five of the selections have not yet been programmed into any screenings.
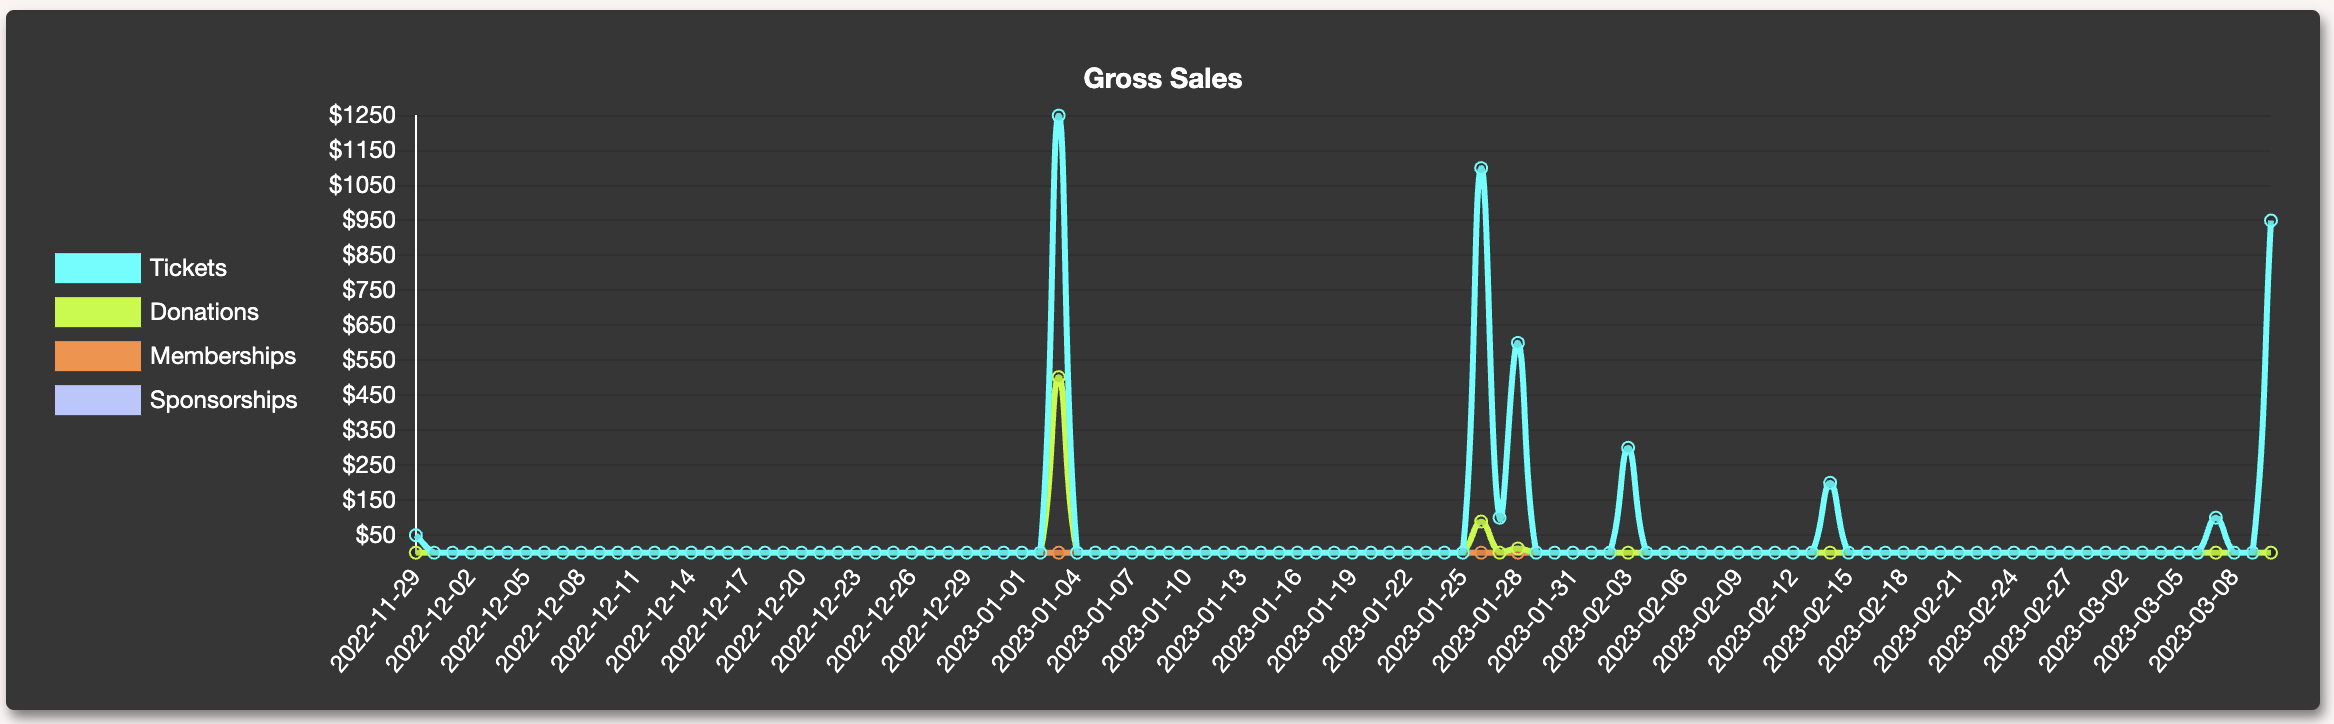
Sales Chart
Phases: planning, running, post-festival
The “Sales Chart” provides your daily sales numbers by product type. As with the “Gross Sales” widget, all numbers are in your festival currency and represents sales before Sparq fees and discounts.
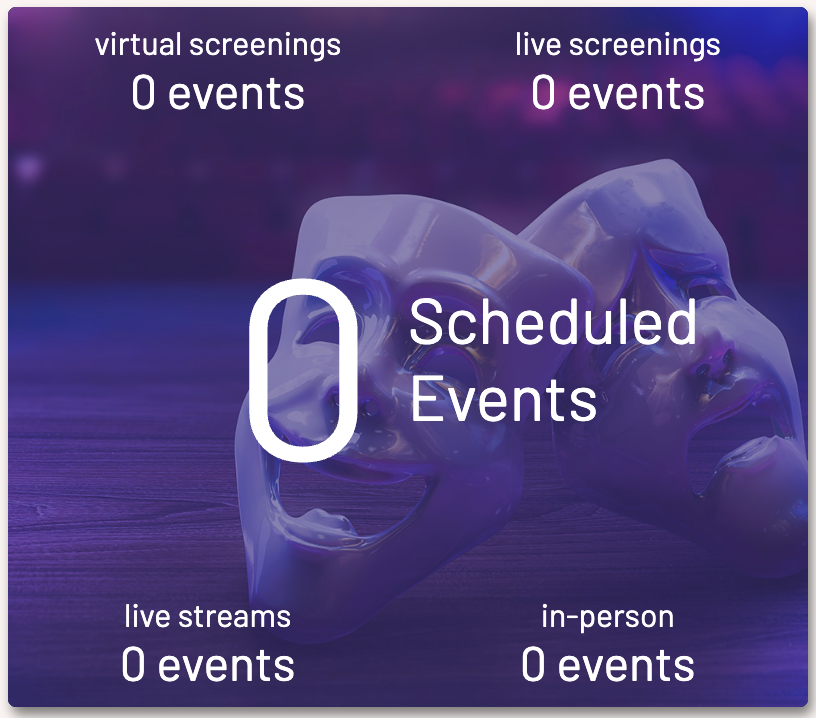
Scheduled Events
Phases: planning
This widget provides you with a running tally of how many events across the different types of events you have created. Note that it separates out in-person screenings from other in-person events.
If you see zeroes in this widget, you will also see a note in the main section asking you to create your first event. The primary use of this widget is to provide a check against where you expect planning to be at a given point during the run-up to your festival.
There are no warnings associated with this widget.
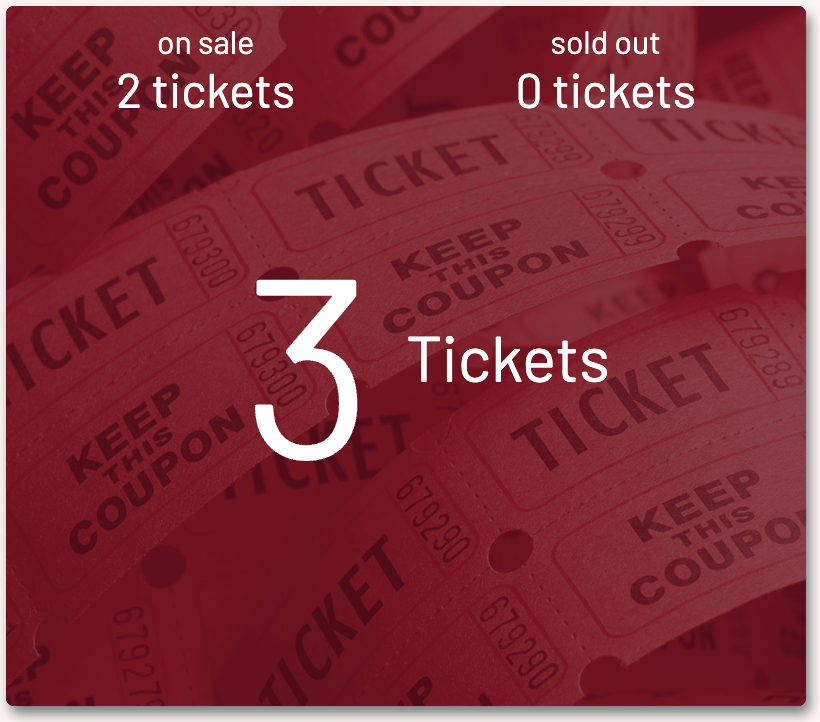
Tickets
Phases: planning, running
The “Tickets” widget provides with with a quick status of your tickets. If you have set up events that require tickets, but there is no ticket supporting the event, this widget will warn you of the oversight.
There are three core numbers in this widget:
- the number of tickets currently on sale
- the number of tickets that are “sold out”
- the number of tickets configured for this edition
If there exists an event requiring tickets and you have not yet set up a ticket that grants access to that event, a warning will show up at the bottom telling you how many events have no tickets.
If there is no indication that you are using SparqFest ticketing, this widget will not show up.
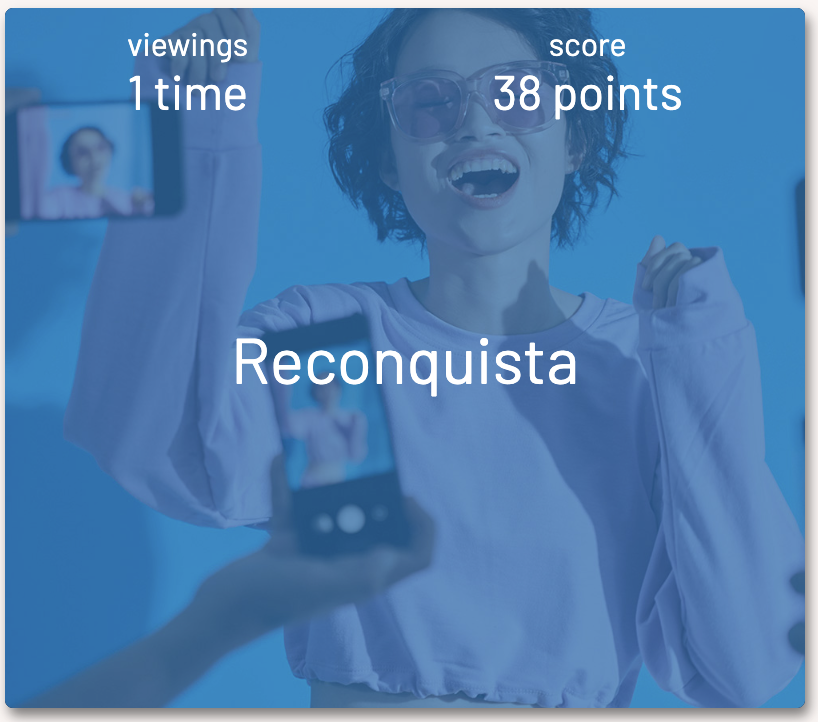
The Top Selection
Phases: running, post-festival
The “Tops” widget shows up only after people have started watching selections. It tells you which selection is the most popular among viewers, at least based on viewing habits.
For the top selection, you can see how many times it has been “seen” and how we score it.
The score is based on a Sparq algorithm that gives points for being played, glimpsed, and seen with different weights assigned to each.
This widget does not indicate if there is a tie.
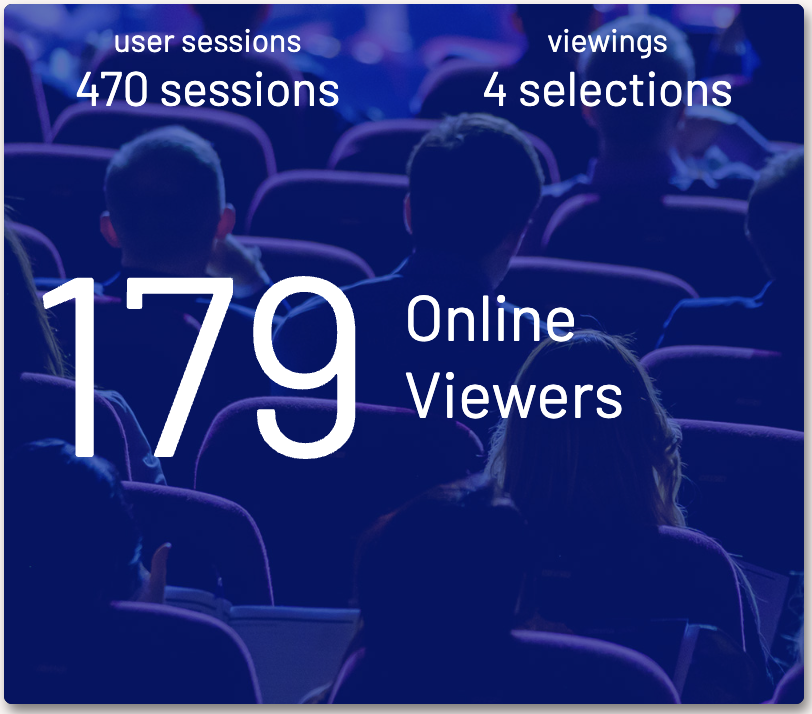
Viewing Overview
Phases: running, post-festival
The “Viewing Overview” widget provides you a quick glance at the summarized data from your Activity Chart. In particular, it breaks viewing down into the number of user sessions, viewings, and viewers.
A “user session” is one person coming to the site at a specific time. During the user session, that viewer may watch any number of selections. If that viewer returns to the site, a new user session will be started.
A “viewer” is one person's activity. In general, one viewer is one user. It is possible, for a variety of reasons, for one person to be associated with multiple “viewers”.